
If you build airline models for a living, you already know the P&L is a sideshow to the unit line. An airline is a machine that manufactures available seat miles and tries to sell each one for more than it costs to produce. Two ratios capture almost the whole equity story — and both of them divide by a number that is manufactured, quite literally, in the schedule.
The two ratios that move the stock
Every airline unit metric is a per-ASM figure, where one ASM is one seat flown one mile (total ASMs = the sum, over every flight, of seats × stage length):
- RASM — operating revenue ÷ ASMs. Unit revenue. Variants: PRASM (passenger revenue only) and TRASM (total revenue). This is the line analysts obsess over, because small moves in revenue-per-seat drop almost straight to the margin.
- CASM — operating cost ÷ ASMs. Unit cost. Usually quoted as CASM-ex (excluding fuel, and often refinery/profit-sharing) so the controllable cost trend is visible under the fuel noise.
The margin, roughly, is the spread between them. The entire bull/bear debate on an airline reduces to one question: is RASM growing faster than CASM, and can it keep doing so?
2026 is a clinic in “capacity discipline”
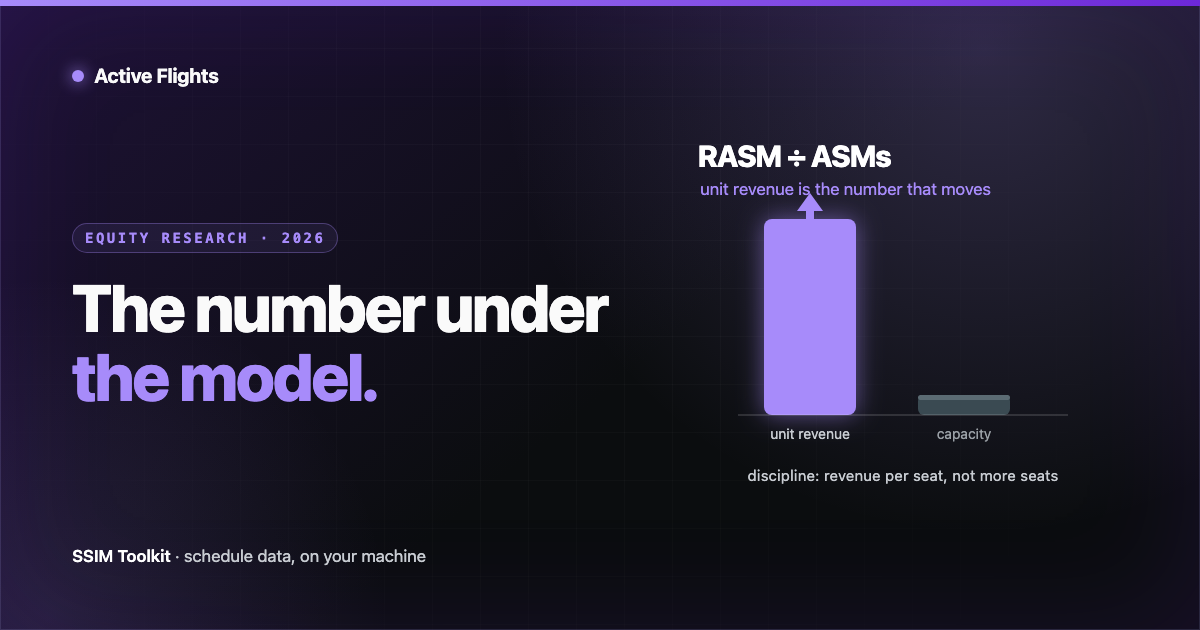
This year is an unusually clean demonstration, because the RASM line is being driven almost entirely by not adding seats. From the Q2 2026 prints:
- Delta grew adjusted TRASM +12.4% year over year and total revenue +14% to a record — on roughly 1% more capacity. Unit cost (CASM-ex) rose +6.8%. Revenue per seat climbed about twelve times faster than the seat count.
- United posted passenger unit revenue (PRASM) +12.1%, with CASM-ex +6.1%.
- Southwest delivered double-digit unit-revenue growth in Q1 2026 while holding CASM-X to +2.3% on just +1.5% capacity.
The mechanism cuts both ways. A carrier that adds seats faster than demand can absorb gets the opposite scissors — unit revenue flat or falling while unit costs keep climbing — in the very same macro environment. Same fuel, same labour market, opposite outcome; the difference is, at root, a capacity choice.
The denominator is a schedule output
Here’s the part that matters if you’re trying to forecast these lines rather than read them
after the fact. Every ratio above is revenue-or-cost ÷ ASMs. Revenue and cost you estimate.
But ASMs are not an estimate — they’re computed, seat by seat, from the published schedule:
aircraft gauge (seats per tail) × stage length × frequency × days of operation.
Change the schedule and you change the denominator of every unit metric at once.
Which is why “capacity discipline” isn’t a slogan — it’s a schedule decision, made months before it shows up in a unit-revenue print. And it’s why the sharpest airline desks don’t wait for the earnings call: they pull forward published-schedule capacity (OAG, Cirium, and the underlying SSIM filings) and compute forward ASMs directly to model next quarter’s RASM before management confirms it. The capacity number is visible in the schedule ahead of the revenue it will divide.
There’s a data-quality corollary that anyone who has built one of these models has felt. Your RASM forecast is only as trustworthy as the seat counts, distances, frequencies, and effective dates feeding the ASM base — and schedule data is full of edge cases: overnight legs, day-of-week variation, equipment swaps, mid-period changes. Get the denominator subtly wrong and a clean-looking unit-revenue model is quietly built on sand.
The read for researchers
The metric that prices the stock — the RASM trajectory — is downstream of a capacity figure you can read in the schedule before the company reports it. That makes the schedule-data layer genuinely alpha-relevant infrastructure, not back-office trivia. The edge goes to whoever can turn raw schedules into a correct, validated ASM base fastest and most reliably.
That’s exactly the layer we build for. SSIM Toolkit reads, validates, and lets you query a schedule — capacity, gauge, stage length, seat miles — locally and deterministically, so the denominator under your model is one your machine computed from the file, not one you hoped was right. In a year when a single point of unit revenue is the difference between a beat and a miss, getting the seat-mile base exactly right is the least glamorous — and most load-bearing — part of the work.
Unit-metric figures are from the carriers’ Q2 2026 (and Southwest’s Q1 2026) reported results, linked below. Definitions are standard airline-reporting conventions.
Sources
Want early access?
We're opening SSIM Toolkit to teams in waves through 2026 — free during the preview. Drop your email and we'll reach out when it's your turn.
You're on the list. Check your inbox for a confirmation email to finish signing up.
Something went wrong — please try again, or email hello@activeflights.com.