
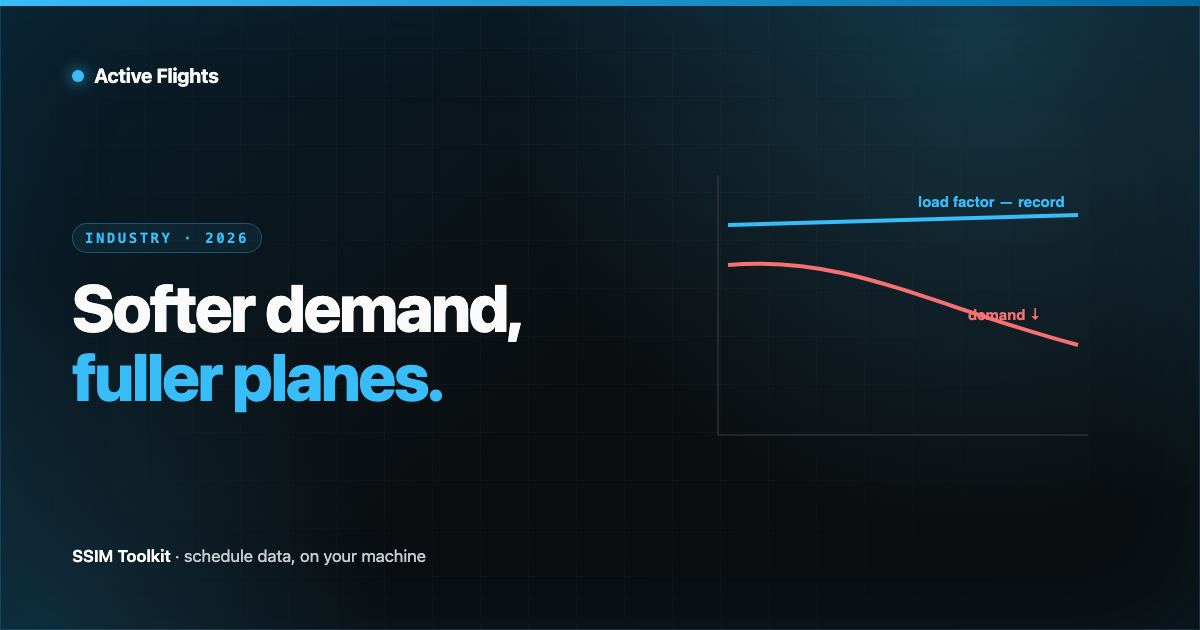
For most of the last few years the story was simple: demand up, planes full, records everywhere. IATA’s May 2026 data complicates it in an instructive way. Global demand fell, and yet planes were fuller than ever for the month. Both things are true, and the reason they’re both true is worth understanding.
The headline numbers
Per IATA, for May 2026 (year-on-year):
| Metric | May 2026 vs May 2025 |
|---|---|
| Total demand (RPK) | −2.2% (but +0.7% excluding the Middle East) |
| Total capacity (ASK) | −2.3% |
| Load factor | 83.5% — a record for May (+0.1 ppt) |
| International demand | −1.6% (+3.1% excl. Middle East) |
| Domestic demand | −3.1% |
The regional split is the key to it:
| Region (May 2026) | Demand YoY | Load factor |
|---|---|---|
| Europe | +3.8% | 85.4% |
| Asia-Pacific | +1.3% | 85.3% |
| (Middle East) | sharply lower — dragging the global average | — |
Why demand can fall while planes stay full
The trick is in the second column: capacity fell almost exactly as much as demand (−2.3% vs −2.2%). When airlines pull down capacity in step with softening demand — and when new aircraft are scarce anyway — the planes that do fly stay full. A record load factor in a down month isn’t a contradiction; it’s capacity discipline meeting a constrained fleet.
It also isn’t uniform. Strip out a single disrupted region (the Middle East) and demand was actually up. Europe and Asia-Pacific kept growing, at load factors above 85%. The “global number” hides a network that’s diverging region by region.
A falling headline with a record load factor is the signature of a tight, disciplined, regionally-split market — not a slack one.
What it means for the schedule
This is exactly the environment where schedule work gets harder, not easier:
- No slack to absorb error. At 83–85% load factors, a mis-modelled connection or an overlooked overlap doesn’t disappear into empty seats — it strands passengers or wastes a scarce aircraft.
- Constant redeployment. When demand shifts between regions, capacity gets moved, not added. Each move is a re-timed, re-fleeted schedule to validate and compare against the last one.
- Regional divergence = more versions. A network pulling down in one region and growing in another produces more schedule change, more often, than a uniformly growing one.
None of this is visible if you only read the top-line growth number. It’s visible in the schedule — in how many times a plan is rebuilt between publication and the day of operation.
The takeaway
Mid-2026 is a reminder that “how full are the planes” and “how fast is demand growing” are different questions, and right now they point in different directions. Full planes on flat-to-soft demand mean airlines are managing capacity tightly against a fleet they can’t easily expand — which puts a premium on getting the schedule, and the data under it, exactly right.
Figures are IATA’s May 2026 air passenger market data; they’re industry aggregates and get revised.
Sources
Want early access?
We're opening SSIM Toolkit to teams in waves through 2026 — free during the preview. Drop your email and we'll reach out when it's your turn.
You're on the list. Check your inbox for a confirmation email to finish signing up.
Something went wrong — please try again, or email hello@activeflights.com.