
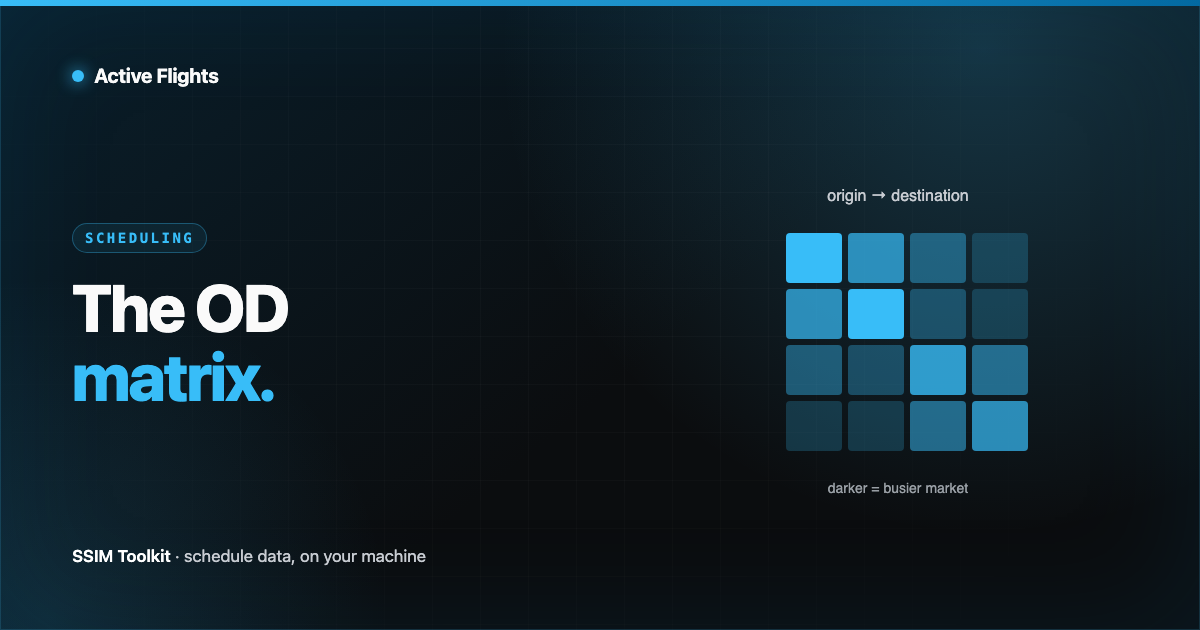
Open a raw SSIM file and what you see is a wall of flight legs — one 200-byte line after another, each a city pair, a set of days, a pair of times. It’s complete, and it’s unreadable. You cannot look at a million legs and see where a network flows. The origin–destination matrix is the oldest trick for fixing that: fold the legs into a grid, and the shape of the network appears.
What an OD matrix is
An OD matrix is a table with origins down the rows and destinations across the columns. Each cell holds a number that measures the traffic the schedule plans between that origin and that destination — most simply, how many flights operate on that directed market.
          →SYD   →MEL   →BNE   →PER   →OOL
  SYD·      —     168    140     56     42
  MEL·     168     —      98     35     28
  BNE·     140     98     —      21     14
  PER·      56     35     21     —       0
  OOL·      42     28     14     0      —
(Illustrative. Rows are the board point, columns the off point; the diagonal is empty because a station doesn’t fly to itself.) Read a row and you see everywhere an airport sends flights. Read a column and you see everywhere it receives them.
What weights a cell
“How many flights” is the starting point, not the finish. The same grid answers different questions depending on what you count in each cell:
- Legs / frequency. A raw count of departures on the market over the period — the quickest read of how thick a market is.
- Weekly frequency. Normalize the count to a typical week so a season-long schedule
and a one-month one are comparable. This ties directly to
days-of-operation expansion: a leg
operating
1234567is seven weekly departures, not one. - Seat capacity. Weight each departure by the aircraft’s seat count and you get planned seats between the pair — a far better proxy for the size of a market than frequency alone. A daily widebody and a daily regional turboprop are one flight each and nothing alike.
Which weight you pick decides what the picture means. Frequency shows how often; seats show how much.
Reading the heatmap
Shade each cell by its value and the matrix becomes a heatmap — the form most people actually work with.
- The bright cluster is the core of the network: the handful of markets carrying most of the flying. On almost every carrier this concentration is stark.
- A bright row or column is a busy station — an origin that feeds many destinations, or a destination many origins feed. That’s the visual signature of a hub, which we go into in hub or point-to-point.
- The empty cells matter too. A sparse matrix with a few dense lanes is a focused network; an evenly-filled one is a dense mesh.
Symmetry and directional imbalance
A useful habit: compare the cell for A→B against the cell for B→A. In a planned schedule they’re usually close — most flights come back — but not always identical.
A gap between the two directions points at something real: a positioning leg, a tag flight, a triangular routing that doesn’t retrace itself, or simply an asymmetric bank structure. When the matrix is badly lopsided, that’s often the first sign of a data problem worth a look in the record inspector — a schedule where aircraft only ever fly one way isn’t a schedule.
The matrix doesn’t just show you the network. Its asymmetries show you where to look harder.
The honest limit: served flows, not demand
Here is the line to keep straight, because it’s the one most often crossed. An OD matrix built from a schedule shows served flows and planned capacity — where the airline has chosen to fly and how much lift it has put there. It does not show true passenger origin–destination demand.
Two reasons. First, SSIM describes the planned schedule: it says a flight is intended to operate SYD–MEL, not how many people bought a seat, nor where their journey truly began or ended. Second, a passenger’s real O&D often spans a connection — someone flying SYD–MEL–LST has a true destination the SYD–MEL leg never records. Reconstructing genuine demand needs booking and traffic data (MIDT, DDS, revenue feeds) that lives entirely outside the schedule file.
| The schedule OD matrix shows | It does not show |
|---|---|
| Directed markets the carrier serves | True passenger O&D demand |
| Planned frequency and seat capacity | Bookings, load, or revenue |
| The shape of the operated network | Where a connecting journey really begins/ends |
Treat a schedule OD matrix as a map of supply, not demand, and it’s one of the most useful views you have. Treat it as demand and you’ll draw the wrong conclusion confidently.
Where it fits
The OD matrix is the natural first analytical view once a schedule is parsed and typed — the fold that turns legs into structure. From there the questions branch: which markets are thickening (capacity and frequency), where the hubs are, how the flying moves across the year (seasonality).
In SSIM Toolkit, the OD matrix is one of the built-in analysis surfaces. Point it at a parsed schedule and it folds the legs into the grid on your own machine — weighted by legs, frequency, or seats, scoped to a carrier or the whole feed — so the shape of the network is a glance away rather than a query you have to write. It reads the planned schedule faithfully and, deliberately, claims nothing about demand it can’t see.
Next, we read the same data a different way: hub or point-to-point — what a carrier’s network philosophy looks like in the schedule itself. More about the app on the SSIM Toolkit product page.
Want early access?
We're opening SSIM Toolkit to teams in waves through 2026 — free during the preview. Drop your email and we'll reach out when it's your turn.
You're on the list. Check your inbox for a confirmation email to finish signing up.
Something went wrong — please try again, or email hello@activeflights.com.