
Six months ago the 2026 story for airlines was quiet stability. In December, IATA pencilled in a record — if thin — net profit and called it “stabilised.” That outlook did not survive contact with the oil market. The revised numbers, and the earnings landing alongside them, are a clean lesson in where an airline’s fate is actually decided when the biggest cost line is out of its hands.
The revision, sized
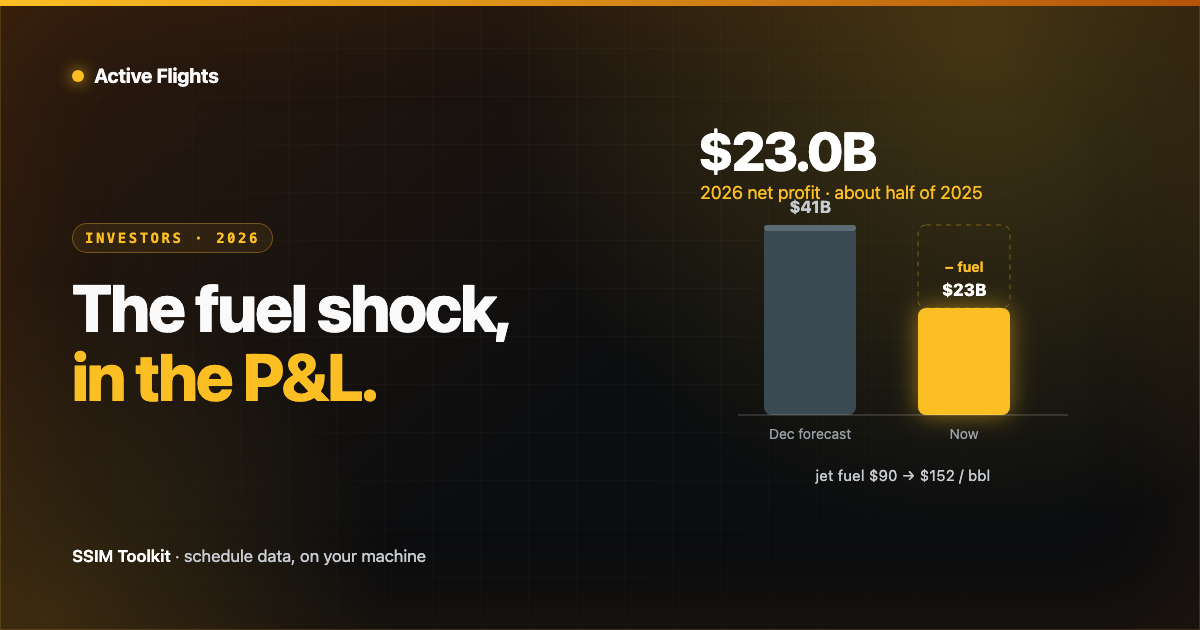
In its mid-2026 update, IATA now expects the industry to earn about $23.0 billion in net profit this year — down from the $41 billion it forecast in December, and roughly half the $45 billion the industry made in 2025. Net margin drops to 2.0%, from 4.2% a year earlier. Profit per passenger falls to $4.50, from $9.10.
The cause is almost entirely one line. IATA attributes the halving to war-related disruption in the Middle East and the fuel-price surge that came with it. Jet fuel is now expected to average $152 a barrel in 2026, up from $90 in 2025 — about a 70% jump — pushing the industry’s fuel bill from $252 billion to $350 billion. Fuel climbs to 31.4% of operating expenses, from 25.4%. Total operating costs rise 13% to $1.117 trillion; revenue, at $1.165 trillion, simply can’t outrun them.
Demand didn’t break — that’s the point
The reflex reading is “bad year, avoid the sector.” The earnings say otherwise. Demand is intact: IATA still sees 5.1 billion passengers in 2026 and a record 84.0% load factor. And the carriers that reported Q2 in July beat expectations through the fuel spike rather than despite ignoring it.
Delta posted adjusted EPS of $1.56 against a ~$1.47 Street estimate, on double-digit revenue growth, and affirmed full-year adjusted EPS guidance of $6.50–$7.50 — explicitly planning to pass more of the fuel increase through to fares. United absorbed an 84% year-over-year jump in fuel expense — about $2.3 billion in the quarter, and a projected ~$6 billion of added fuel cost for the full year versus its January plan — still beat with $1.99 adjusted EPS, and raised its full-year guide.
So the sector-level profit halved while the best operators raised guidance. That divergence is the investor signal. When a shared, uncontrollable input hits everyone equally, the spread between winners and losers isn’t set by the input — it’s set by how tightly each carrier runs the parts it does control. And the largest of those is the network.
Why the schedule is the lever
Fuel price is exogenous; an airline can hedge it and pass some of it on, but it can’t set it. What it can set is how much flying it does, where, with which aircraft, and how efficiently those aircraft and crews are used. All of that is the schedule. In a 2.0%- margin year, the schedule stops being back-office plumbing and becomes the primary margin-defense instrument:
- Utilization. With fuel this expensive, an idle aircraft or a thin-load frequency is more punishing than it was at 25%-of-cost fuel. Trimming the marginal rotation is a schedule decision made against schedule data.
- Connection integrity. A misconnect now costs more — reaccommodation, fuel burned on a rebooked routing, a soured premium passenger. The minimum-connect-time assumptions and banking structure buried in the schedule decide how much of that risk the airline is carrying.
- Honest block times and capacity. Route-economics calls are only as good as the block times, aircraft types, and seat counts they’re computed from — all of which live in the SSIM schedule, and all of which quietly rot if nobody validates them.
“Disciplined capacity management” — the phrase in every bullish airline note this quarter — is a euphemism for schedule discipline. It is won or lost in the schedule file long before it shows up in an earnings call.
The investor read
For anyone looking at aviation from the capital side, the fuel shock reframes the same thesis we keep returning to: the durable edge isn’t in the volatile inputs everyone shares, it’s in the operational data layer where the controllable decisions get made. Spending keeps flowing to the passenger-facing, AI-flavored top of the stack — we sized that gap earlier — while the schedule substrate underneath stays under-tooled. A thin-margin year is exactly when that substrate earns its keep, because there’s no slack left to paper over a schedule that’s wrong.
That is the whole reason SSIM Toolkit is built the way it is: local, deterministic, full-fidelity. When margin depends on reading the schedule correctly, you want an answer your machine computed from the file — not one a model guessed. Fuel will eventually come back down. The premium on getting the schedule right won’t.
Figures are from IATA’s June 2026 financial outlook and the carriers’ Q2 2026 results. Industry aggregates are IATA estimates and will be revised as the year develops.
Sources
- IATA — Middle East Disruptions and High Fuel Prices Halve Airline Industry Profitability (June 2026)
- IATA — Airline Profitability Stabilizes with 3.9% Net Margin Expected in 2026 (December 2025)
- Delta Air Lines — June Quarter 2026 Financial Results (SEC Form 8-K)
- United Airlines Holdings — Second-Quarter 2026 Results (SEC Form 8-K)
Want early access?
We're opening SSIM Toolkit to teams in waves through 2026 — free during the preview. Drop your email and we'll reach out when it's your turn.
You're on the list. Check your inbox for a confirmation email to finish signing up.
Something went wrong — please try again, or email hello@activeflights.com.