


How Airlines Decide Which Routes to Fly
How airlines decide which routes to fly: demand, rivals, the right aircraft, airport slots, hub connections, seasons, and whether the route makes money.
Airline load factor is the share of seats an airline fills. How it's calculated, why it hit a record 83.6% in 2025, and what a full plane doesn't tell you.
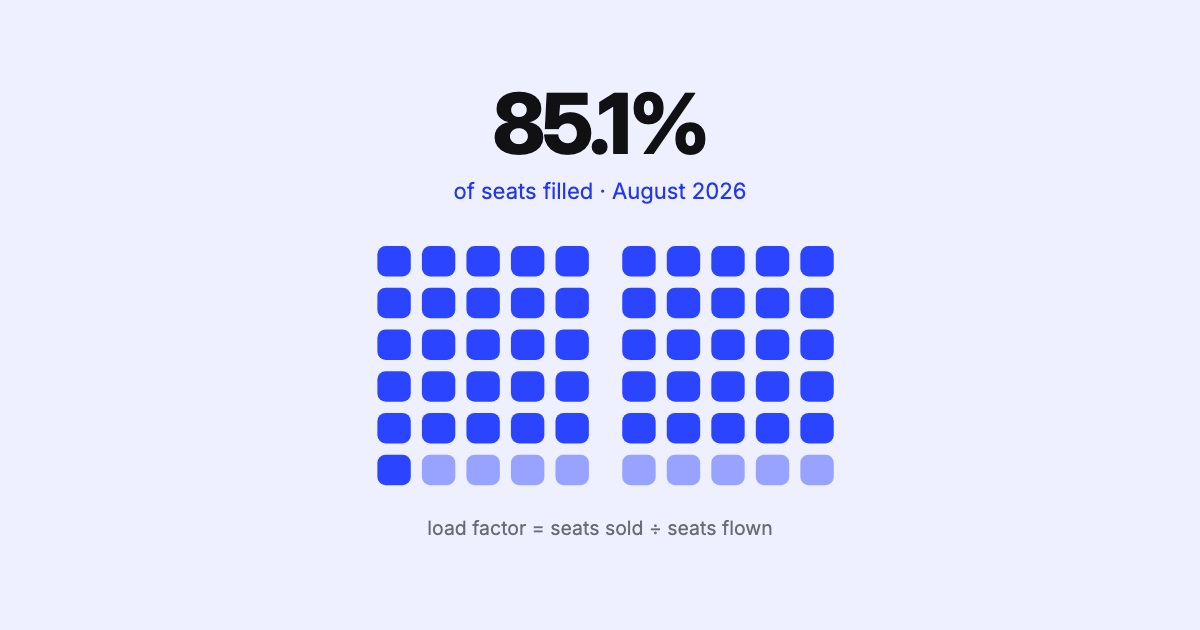
Load factor is the share of an airline’s seats that are filled with paying passengers. If a plane flies with 85 of every 100 seats sold, its load factor is 85%. Across a whole airline, or the whole industry, the same idea is measured in seats and distance, so a long flight counts for more than a short hop.
If your last few flights felt packed, the numbers agree with you. In August 2026, airlines worldwide filled 85.1% of the seats they flew. In 2025, the full-year figure was 83.6%, a record. (IATA, IATA)
Here’s what that number means, how it’s worked out, and why a full plane isn’t automatically a profitable one.
Two measures do the work, and both are simpler than their names.
Load factor = RPK ÷ ASK. IATA puts it plainly: passenger load factor is the percentage of ASKs used. US airlines report the same thing in miles (RPM ÷ ASM). For one flight on its own, the distance cancels out, and load factor is simply passengers divided by seats. (IATA, MIT Airline Data Project)
Why bother with distance at all? Because across a network it matters where the empty seats are. An empty seat on a 12-hour flight wastes far more of what the airline produced than an empty seat on a 40-minute hop. Weighting by distance makes the industry number reflect that.
There’s no single “good” number, but there is a line that matters: the breakeven load factor, the share of seats an airline must fill just to cover its costs at the fares it’s charging.
IATA has noted that the steady rise in load factors over the decades was “a necessary response” to a similar rise in that breakeven level. In other words, airlines didn’t fill planes fuller just because they could. They had to, to stay above water. (IATA Economics)
Much fuller than a generation ago. In the early 1990s the industry figure sat in the high 60s: IATA notes it took nearly seven years, in the early 1990s, to make the jump from 68% to 69%. It first passed 82% (seasonally adjusted) in November 2017, and reached a full-year record of 82.6% in 2019. (IATA Economics, IATA)
Since then the line has kept climbing. 2025 set a new full-year record at 83.6%, and IATA’s outlook expects 83.8% for 2026. In the busy summer months the figure runs higher still: 85.2% in July 2026 and 85.1% in August. (IATA, IATA, IATA)
Part of it is demand, and part of it is a shortage. IATA’s own forecast says the 2026 record is expected “as new aircraft remain in short supply,” and that high load factors are “partially attributable to supply chain issues.” When airlines can’t get the new jets they ordered, they can’t add seats as fast as people want to fly, so the seats they do have fill up. (We looked at that squeeze in the 2026 capacity squeeze.) (IATA)
It also isn’t the same everywhere. In IATA’s August 2026 figures, Europe ran at 87.5%; Africa at 77.5%. (IATA)
Load factor is the most quoted airline statistic, and one of the easiest to over-read.
It says nothing about price. A plane full of cheap tickets can earn less than an emptier one carrying passengers who paid more. That’s why analysts pair load factor with yield, the average fare per passenger-kilometre. Multiply the two and you get passenger revenue per available seat-kilometre, the number that actually pays the bills. (MIT Airline Data Project) Our guide to RASM and CASM goes further into that.
It averages away the peaks. IATA expects 83.8% for 2026 as a whole, yet July and August both ran above 85%. A yearly figure smooths over the busiest and quietest flights alike.
It moves for more than one reason. In August 2026, the industry load factor was 85.1%, yet it was 0.9 points lower than a year earlier, as demand slipped while capacity grew slightly. A falling load factor can mean weaker demand; a rising one can simply mean there aren’t enough planes. (IATA)
100% isn’t the goal. A plane that’s always full is turning passengers away. It’s the same forecasting problem behind why airlines overbook: the target is the right seats at the right price, not every seat at any price.
Every load factor has a denominator, and it starts in the schedule: which flights operate, on which aircraft, with how many seats, over what distance. Get the seat count or the operating days wrong and the “available” half of the ratio is wrong before a single ticket is sold. That’s the side of the equation our SSIM Toolkit works on, counting the seats and flights a schedule really offers, on your own machine.
Sources
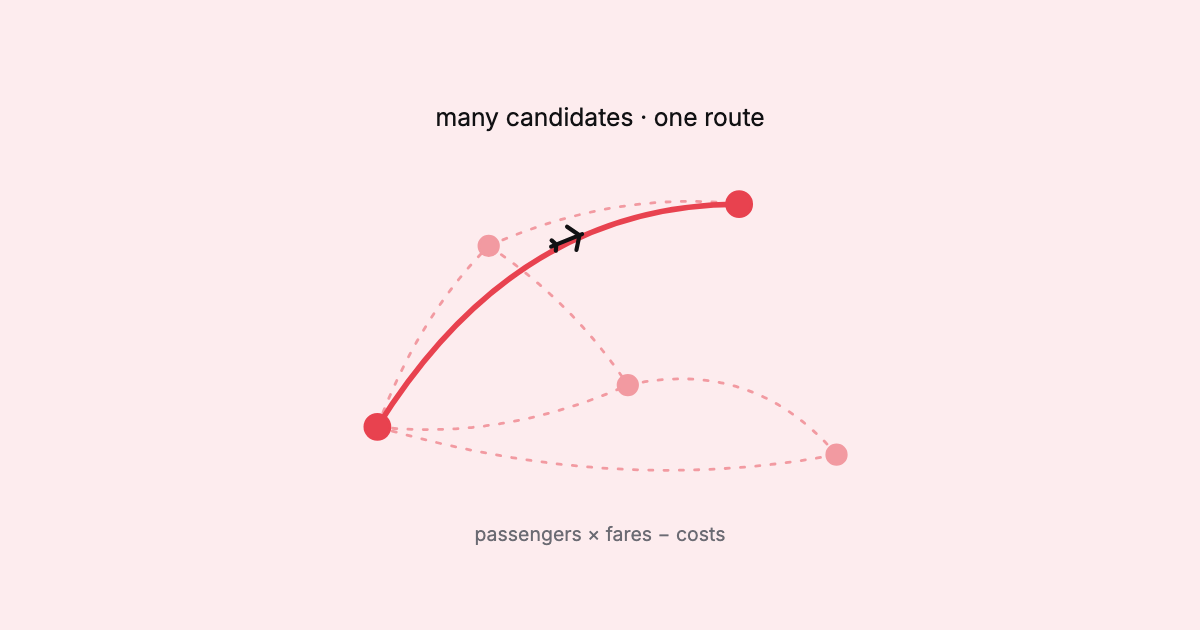
How airlines decide which routes to fly: demand, rivals, the right aircraft, airport slots, hub connections, seasons, and whether the route makes money.
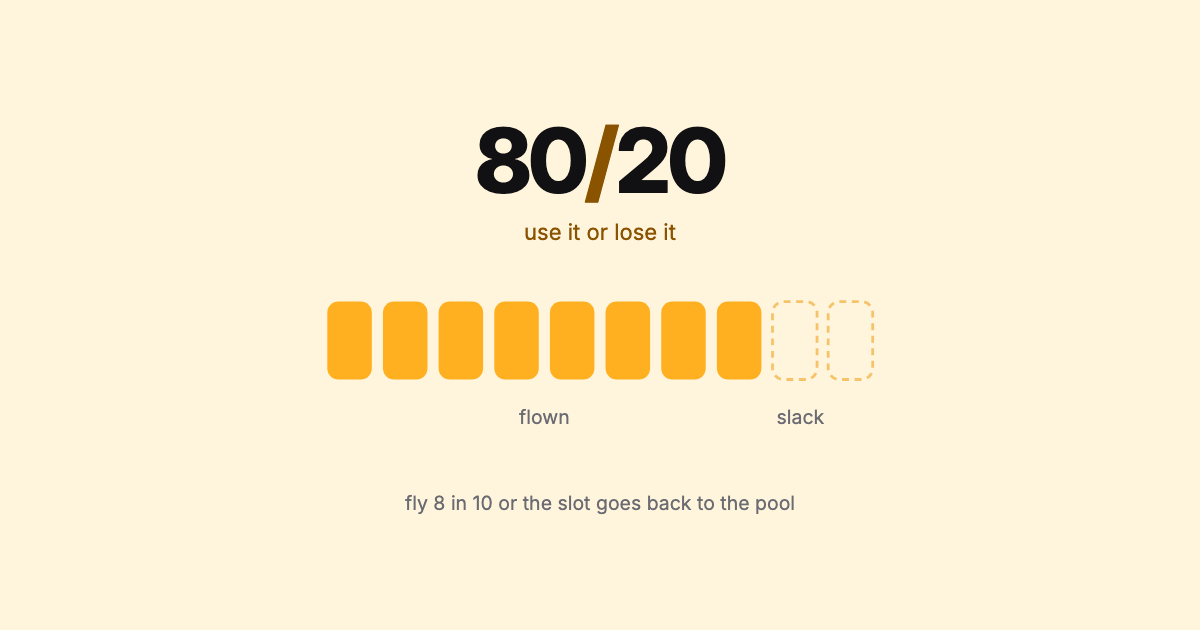
The 80/20 slot rule: fly a slot series 80% of the time or lose it. Where it applies, what COVID changed, ghost flights, and where the rule stands now.
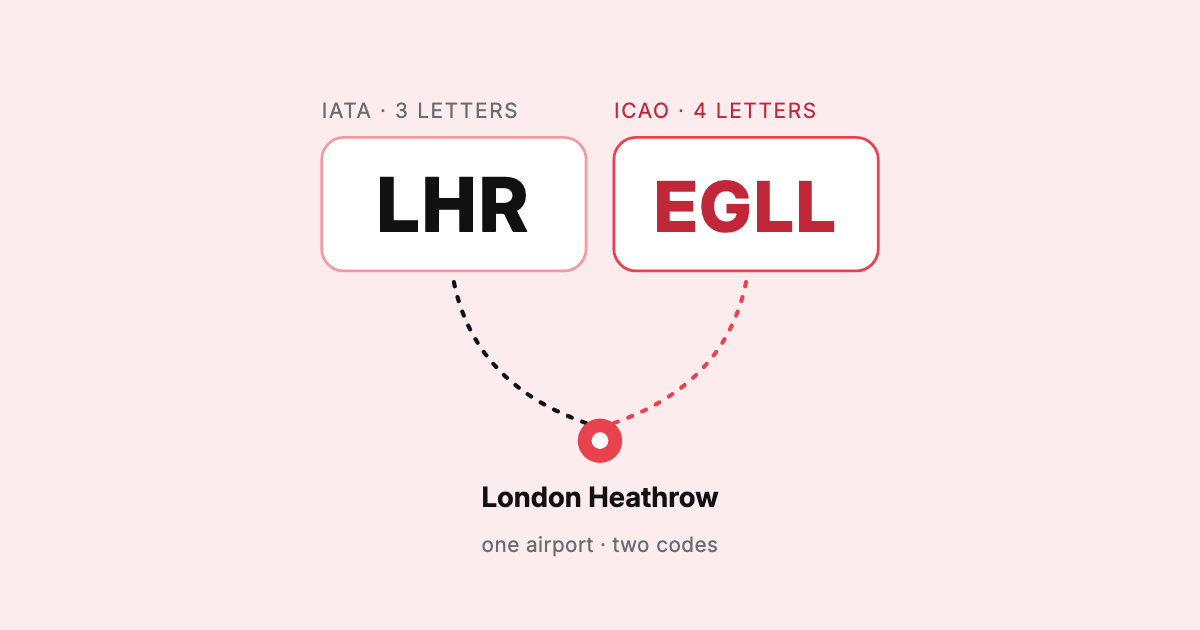
IATA vs ICAO airport codes explained: why airports have a three-letter and a four-letter code, who assigns each, where they're used, and why LAX has an X.