


What Is Airline Load Factor? Why Planes Are So Full Now
Airline load factor is the share of seats an airline fills. How it's calculated, why it hit a record 83.6% in 2025, and what a full plane doesn't tell you.
How airlines decide which routes to fly: demand, rivals, the right aircraft, airport slots, hub connections, seasons, and whether the route makes money.
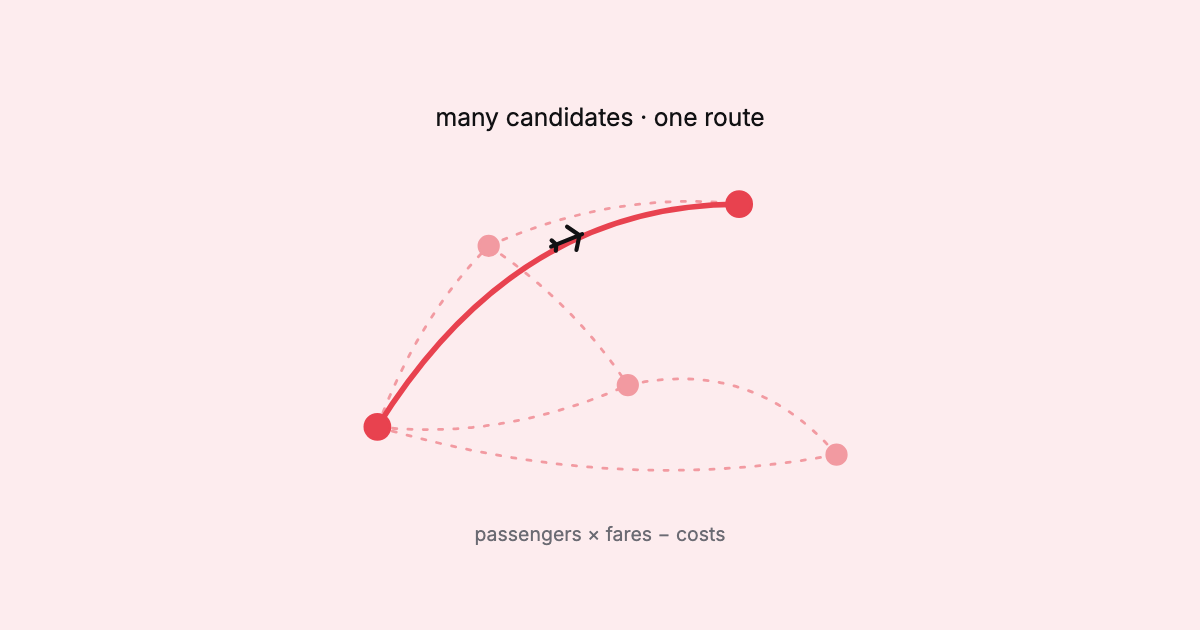
Airlines decide which routes to fly by asking whether enough people will pay enough to cover the cost of flying there, and then whether they have the aircraft, the airport access and the network to make it work. A planning team keeps a long list of possible routes; most never make the cut.
When an airline announces a shiny new nonstop, it looks like a sudden decision. It rarely is. At Finland’s airport operator Finavia, the head of route development described the path from a first meeting to a launched route as one that “can take several years.” (Finavia)
Here are the questions a route has to survive along the way.
Strip it back and the test is one line. Finavia’s Timo Järvelä put it like this: “Multiply the predicted amount of passengers with the predicted prices, and deduct the costs of running the route.” Airlines launch a route, he said, “if they foresee that there will be enough passengers willing to pay a sufficient price.” The hard part, as he noted, is predicting those numbers. (Finavia)
Everything else, from aircraft to airport slots, is a way of filling in those three boxes honestly.
The first number is how many people want to travel between two places, not just how many fly there today. Airlines and airports analyse large data sets for this, some gathered themselves and some bought from booking companies and databases. As Järvelä explained, analytics can show “how many people fly from Gothenburg to Shanghai monthly, regardless of the stopover airport.” (Finavia)
That “regardless of the stopover” is the key idea. Passengers already connecting somewhere to make a trip are the obvious first customers for a nonstop. Planners call this origin and destination (O&D) demand, and we explain it in the OD matrix, explained.
Demand is shared. If a rival already flies the route several times a day, a newcomer has to win passengers away, which can mean competing on price and shrinks the “fares” box in the formula. A route with strong demand and no nonstop service is the planner’s dream; a crowded one needs a reason to be different, such as better timings, a better product or connections the rival can’t offer.
A route has to fit a plane the airline actually has, in range and in size. Too big, and seats fly empty; too small, and the airline turns people away.
Range can open routes that never existed. Qantas’s “Project Sunrise” is its plan to fly nonstop from Sydney and Melbourne to London and New York, flights of more than 10,000 miles that could take over 20 hours. It needs specially adapted Airbus A350-1000s (often called the A350-1000ULR) with an extra fuel tank and just 238 seats, and the first delivery was pushed back to April 2027. (One Mile at a Time) No aircraft, no route, however strong the demand.
At the world’s busiest airports, you can’t simply turn up. You need an airport slot, a permission to land or take off at a set time. At a slot-coordinated airport, a great route on paper can be blocked by having no slots at the right hour. Our plain guide to airport slots and the schedule covers how they work, and the 80/20 slot rule explains why airlines fight to keep the ones they hold.
For a hub airline, a route is rarely judged on its own. A flight into the hub also carries people connecting onward, so its value includes the trips it makes possible elsewhere. That’s the logic of hub-and-spoke vs point-to-point networks.
Timing matters here: a flight that arrives too late to connect earns only its local passengers. OAG noted that British Airways’ late-arriving Rimini services were “hardly delivering connecting traffic for the airline”; they earn their place in other ways, as the next section shows. (OAG)
Many routes only make sense for part of the year, which is why airlines plan summer and winter schedules separately. And most of a network doesn’t change much between seasons. OAG estimates that “around 85% of an airline’s fleet rolls over from one season to the next,” leaving about 15% for change. (OAG)
That slice is where experiments happen. In a May 2026 look at summer flying, OAG pointed to British Airways flying to Rimini three times a week and to Rhodes and Ponta Delgada twice weekly, and Air France twice weekly to Malta, Rhodes and Verona. BA’s Rimini flying alone used 120 slots and 295 flying hours on A319s and A320s over the summer, which OAG called “a useful top-up on production.” (OAG)
In the end, every question comes back to the formula. Sometimes outside help tips the balance: OAG notes that a trial is more attractive when it covers its costs and gets marketing support from the local tourism agencies, and Finavia has backed tourism marketing in Germany for Finnish Lapland, working with airlines and Lapland’s tourism operators. (OAG, Finavia)
Routes also start small and grow when they work. Finavia cited Qatar Airways’ Helsinki–Doha service, which began as a daily narrow-body flight with plans to move up to a Boeing 787. (Finavia) And routes that don’t work get cut, which is why the network you see each season is never quite the one you saw last year. The whole process is part of the wider airline planning cycle.
Once a route is chosen, it becomes rows in a schedule file: flight numbers, days of operation, times, aircraft and seats, shared with the rest of the industry. That published schedule is also how anyone outside the airline can see the decisions being made, season by season. Reading it at that level, routes, competitors and capacity, is what SSIM Toolkit is built for, on your own machine.
Sources
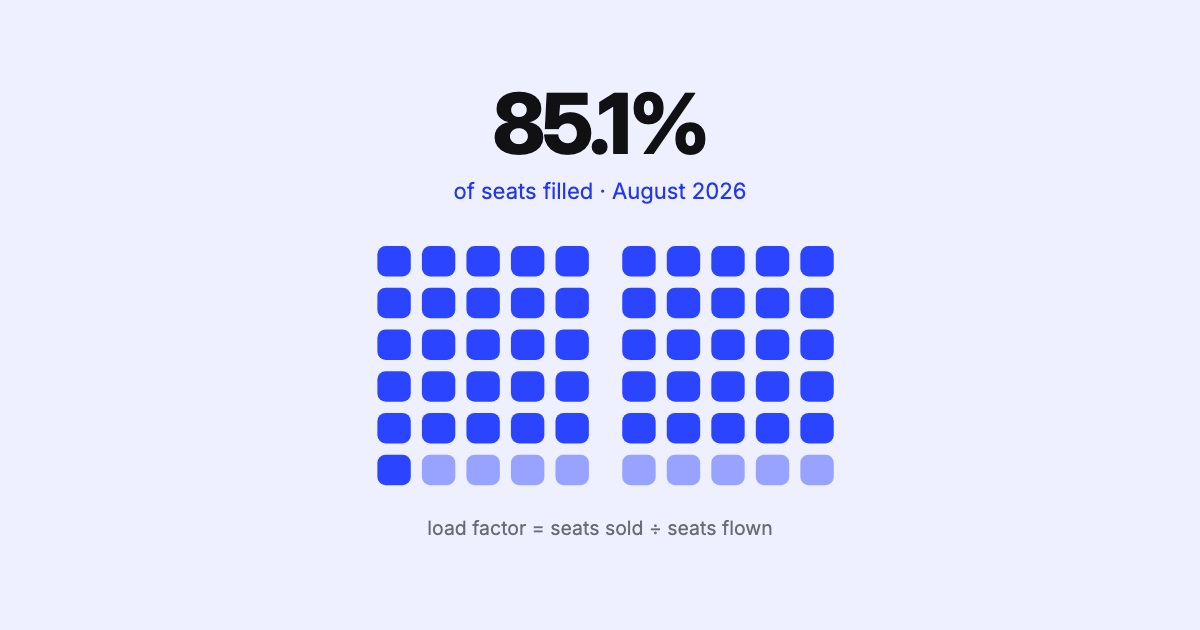
Airline load factor is the share of seats an airline fills. How it's calculated, why it hit a record 83.6% in 2025, and what a full plane doesn't tell you.
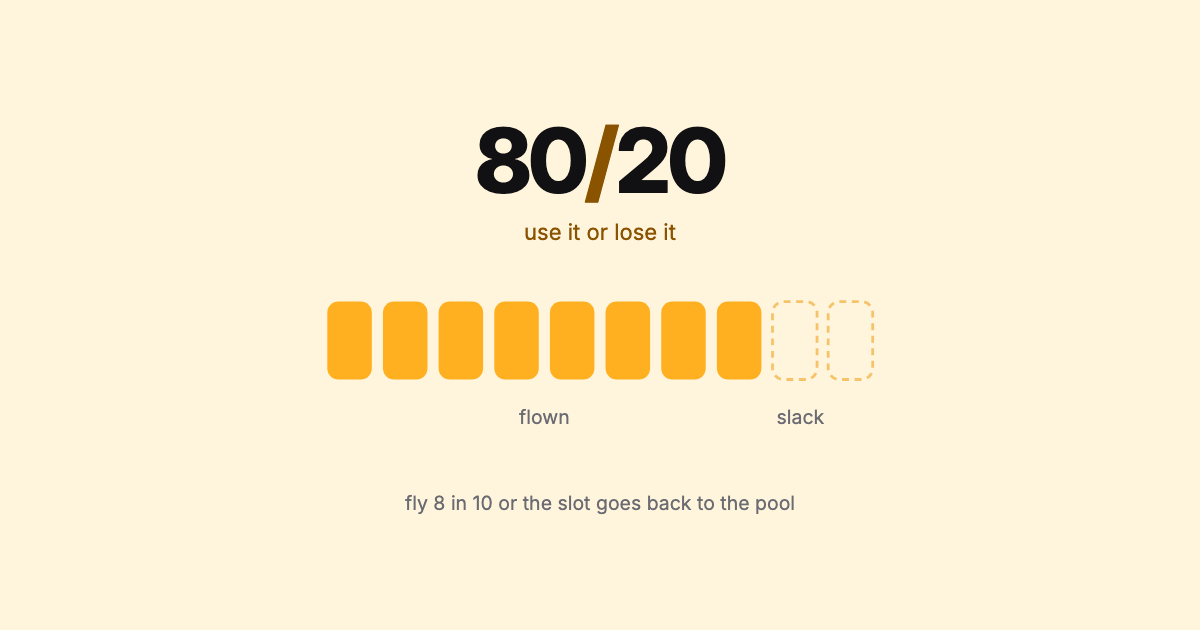
The 80/20 slot rule: fly a slot series 80% of the time or lose it. Where it applies, what COVID changed, ghost flights, and where the rule stands now.
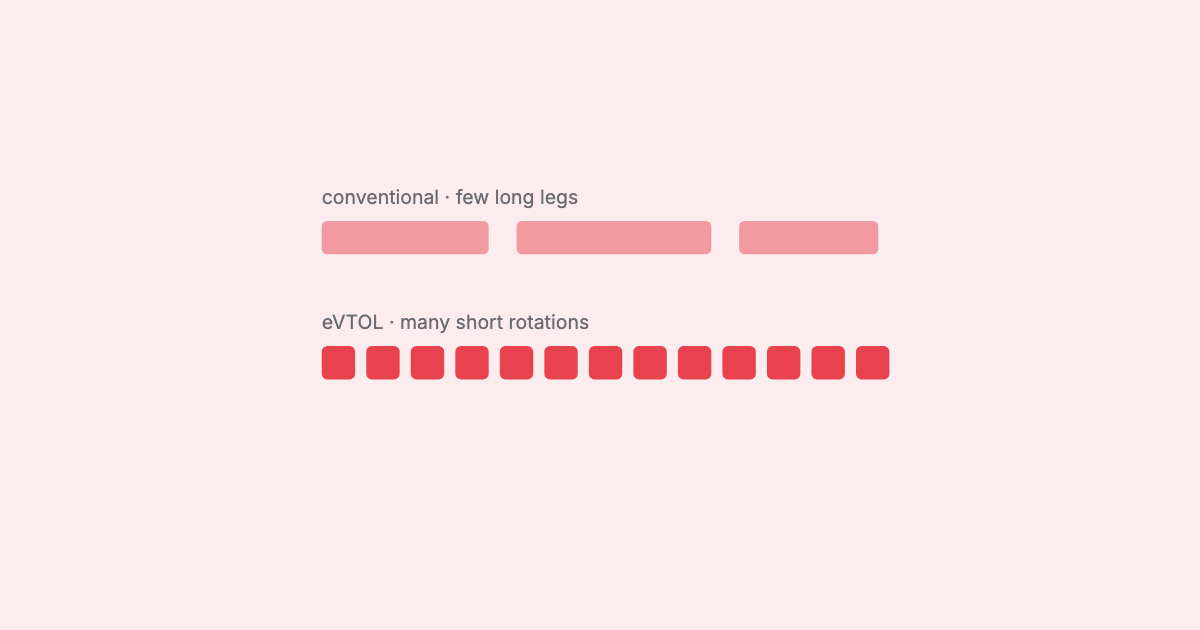
eVTOL aircraft are moving from concept to the airshow flight line. When electric air taxis start operating at scale, they'll bring a scheduling problem that looks familiar — just faster, denser, and newer.